Plot cumulative ranking curves from MBNMA models
cumrank.RdPlot cumulative ranking curves from MBNMA models
Arguments
- x
An object of class
"mb.rank"generated byrank.mbnma()- sucra
A logical object to indicate whether Surface Under Cumulative Ranking Curve (SUCRA) values should be calculated and returned as a data frame. Areas calculated using trapezoid approach.
- ...
Arguments to be sent to
ggplot::geom_line()
Value
Line plots showing the cumulative ranking probabilities for each agent/class for
the ranked dose response paramtere in x. The object returned is a list which contains the plot
(an object of class(c("gg", "ggplot")) and a data frame of SUCRA values
if sucra = TRUE.
Examples
# \donttest{
# Using the alogliptin data
network <- mb.network(alog_pcfb)
#> Reference treatment is `placebo`
#> Studies reporting change from baseline automatically identified from the data
# Estimate rankings from an Emax dose-response MBNMA
emax <- mb.run(network, fun=temax())
#> 'et50' parameters must take positive values.
#> Default half-normal prior restricts posterior to positive values.
#> Compiling model graph
#> Resolving undeclared variables
#> Allocating nodes
#> Graph information:
#> Observed stochastic nodes: 233
#> Unobserved stochastic nodes: 38
#> Total graph size: 4166
#>
#> Initializing model
#>
ranks <- rank(emax, param=c("emax"))
# Plot cumulative rankings for both dose-response parameters simultaneously
# Note that SUCRA values are also returned
cumrank(ranks)
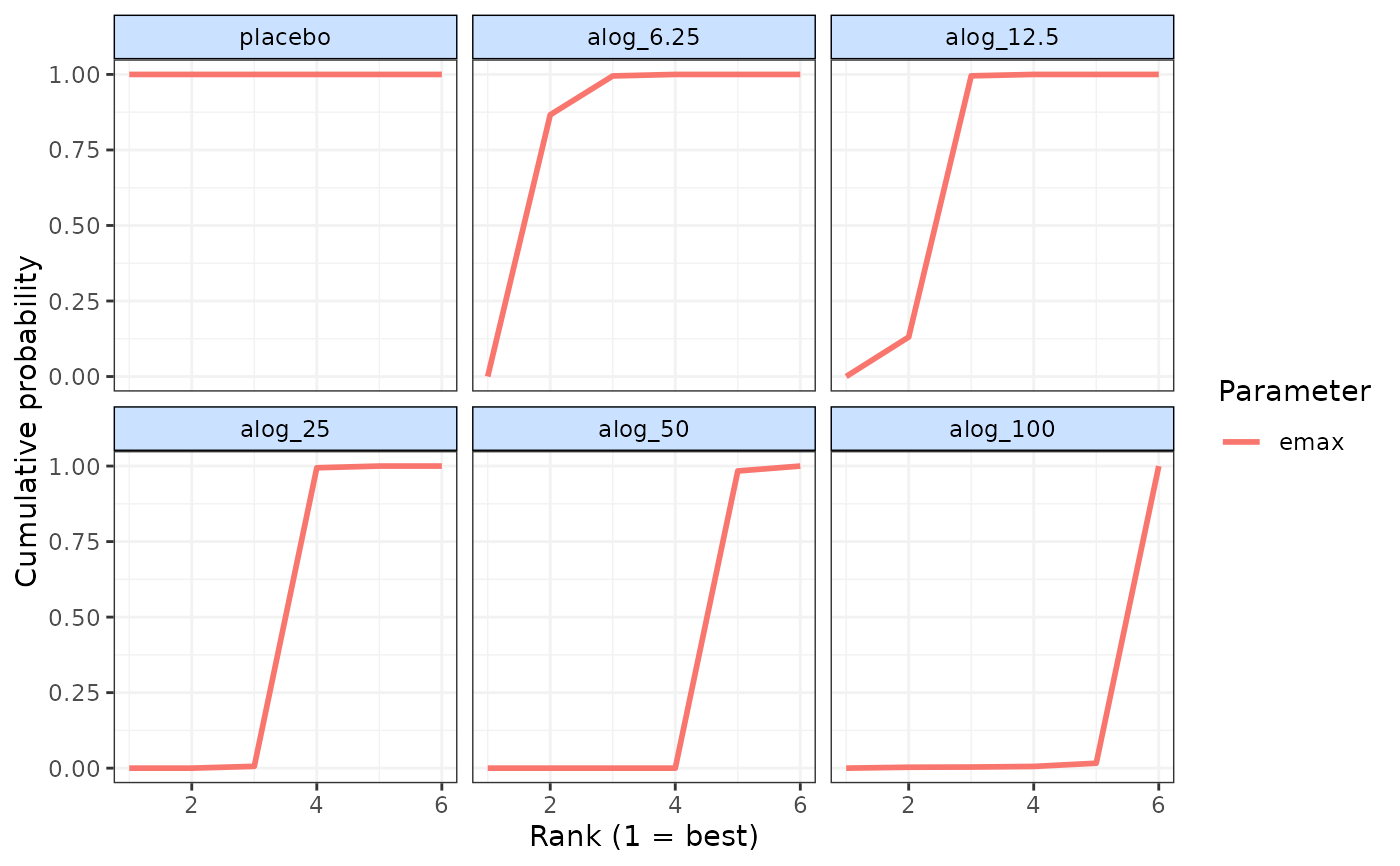 #> # A tibble: 6 × 3
#> treatment parameter sucra
#> <fct> <chr> <dbl>
#> 1 placebo emax 0.833
#> 2 alog_6.25 emax 0.729
#> 3 alog_12.5 emax 0.603
#> 4 alog_25 emax 0.417
#> 5 alog_50 emax 0.248
#> 6 alog_100 emax 0.0876
# }
#> # A tibble: 6 × 3
#> treatment parameter sucra
#> <fct> <chr> <dbl>
#> 1 placebo emax 0.833
#> 2 alog_6.25 emax 0.729
#> 3 alog_12.5 emax 0.603
#> 4 alog_25 emax 0.417
#> 5 alog_50 emax 0.248
#> 6 alog_100 emax 0.0876
# }