Dev-dev plot for comparing deviance contributions from two models
devdev.RdPlots the deviances of two model types for comparison. Often used to assess consistency by comparing consistency (NMA or MBNMA) and unrelated mean effects (UME) models (see Pedder et al. (2021) ). Models must be run on the same set of data or the deviance comparisons will not be valid.
devdev(mod1, mod2, dev.type = "resdev", n.iter = 2000, n.thin = 1, ...)Arguments
- mod1
First model for which to plot deviance contributions
- mod2
Second model for which to plot deviance contributions
- dev.type
STILL IN DEVELOPMENT FOR MBNMAdose! Deviances to plot - can be either residual deviances (
"resdev", the default) or deviances ("dev")- n.iter
number of total iterations per chain (including burn in; default: 2000)
- n.thin
thinning rate. Must be a positive integer. Set
n.thin> 1 to save memory and computation time ifn.iteris large. Default ismax(1, floor(n.chains * (n.iter-n.burnin) / 1000))which will only thin if there are at least 2000 simulations.- ...
Arguments to be sent to
ggplot2::geom_point()orggplot2::geom_boxplot
Examples
# \donttest{
# Using the triptans data
network <- mbnma.network(triptans)
#> Values for `agent` with dose = 0 have been recoded to `Placebo`
#> agent is being recoded to enforce sequential numbering
# Run an poorly fitting linear dose-response
lin <- mbnma.run(network, fun=dpoly(degree=1))
#> `likelihood` not given by user - set to `binomial` based on data provided
#> `link` not given by user - set to `logit` based on assigned value for `likelihood`
#> Compiling model graph
#> Resolving undeclared variables
#> Allocating nodes
#> Graph information:
#> Observed stochastic nodes: 182
#> Unobserved stochastic nodes: 77
#> Total graph size: 3630
#>
#> Initializing model
#>
# Run a better fitting Emax dose-response
emax <- mbnma.run(network, fun=demax())
#> `likelihood` not given by user - set to `binomial` based on data provided
#> `link` not given by user - set to `logit` based on assigned value for `likelihood`
#> Compiling model graph
#> Resolving undeclared variables
#> Allocating nodes
#> Graph information:
#> Observed stochastic nodes: 182
#> Unobserved stochastic nodes: 84
#> Total graph size: 3684
#>
#> Initializing model
#>
# Run a standard NMA with unrelated mean effects (UME)
ume <- nma.run(network, UME=TRUE)
#> Compiling model graph
#> Resolving undeclared variables
#> Allocating nodes
#> Graph information:
#> Observed stochastic nodes: 182
#> Unobserved stochastic nodes: 323
#> Total graph size: 3641
#>
#> Initializing model
#>
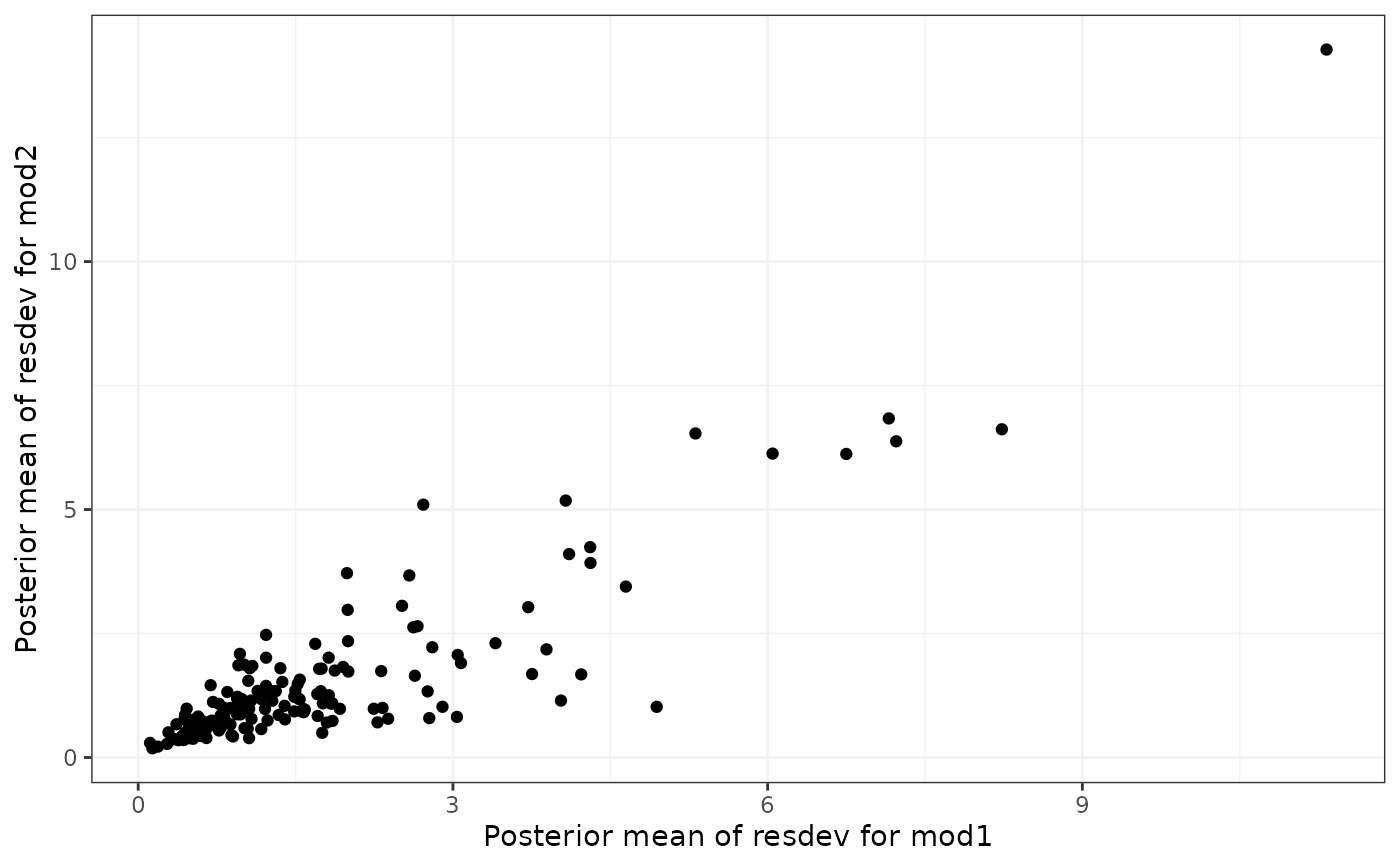
# Compare residual deviance contributions from linear and Emax
devdev(lin, emax) # Suggests model fit is very different
#> `resdev` not monitored in mod1$parameters.to.save.
#> additional iterations will be run in order to obtain results for `resdev`
#> `resdev` not monitored in mod2$parameters.to.save.
#> additional iterations will be run in order to obtain results for `resdev`
 # Compare deviance contributions from Emax and UME
devdev(emax, ume) # Suggests model fit is similar
#> `resdev` not monitored in mod1$parameters.to.save.
#> additional iterations will be run in order to obtain results for `resdev`
#> `resdev` not monitored in mod2$parameters.to.save.
#> additional iterations will be run in order to obtain results for `resdev`
# Compare deviance contributions from Emax and UME
devdev(emax, ume) # Suggests model fit is similar
#> `resdev` not monitored in mod1$parameters.to.save.
#> additional iterations will be run in order to obtain results for `resdev`
#> `resdev` not monitored in mod2$parameters.to.save.
#> additional iterations will be run in order to obtain results for `resdev`
 # }
# }