Plot histograms of rankings from MBNMA models
plot.mbnma.rank.RdPlot histograms of rankings from MBNMA models
# S3 method for class 'mbnma.rank'
plot(x, params = NULL, treat.labs = NULL, ...)
Arguments
- x
An object of class
"mbnma.rank"generated byrank.mbnma()- params
A character vector of named parameters in the model that vary by either agent or class (depending on the value assigned to
level). If left asNULL(the default), then ranking will be calculated for all available parameters that vary by agent/class.- treat.labs
A vector of treatment labels in the same order as treatment codes. Easiest to use treatment labels stored by
mbnma.network()- ...
Arguments to be sent to
ggplot::geom_bar()
Value
A series of histograms that show rankings for each treatment/agent/prediction, with a
separate panel for each parameter.
The object returned is a list containing a separate element for each parameter in params
which is an object of class(c("gg", "ggplot")).
Examples
# \donttest{
# Using the triptans data
network <- mbnma.network(triptans)
#> Values for `agent` with dose = 0 have been recoded to `Placebo`
#> agent is being recoded to enforce sequential numbering
# Estimate rankings from an Emax dose-response MBNMA
emax <- mbnma.run(network, fun=demax(), method="random")
#> `likelihood` not given by user - set to `binomial` based on data provided
#> `link` not given by user - set to `logit` based on assigned value for `likelihood`
#> Compiling model graph
#> Resolving undeclared variables
#> Allocating nodes
#> Graph information:
#> Observed stochastic nodes: 182
#> Unobserved stochastic nodes: 197
#> Total graph size: 4115
#>
#> Initializing model
#>
ranks <- rank(emax)
# Plot rankings for both dose-response parameters (in two separate plots)
plot(ranks)
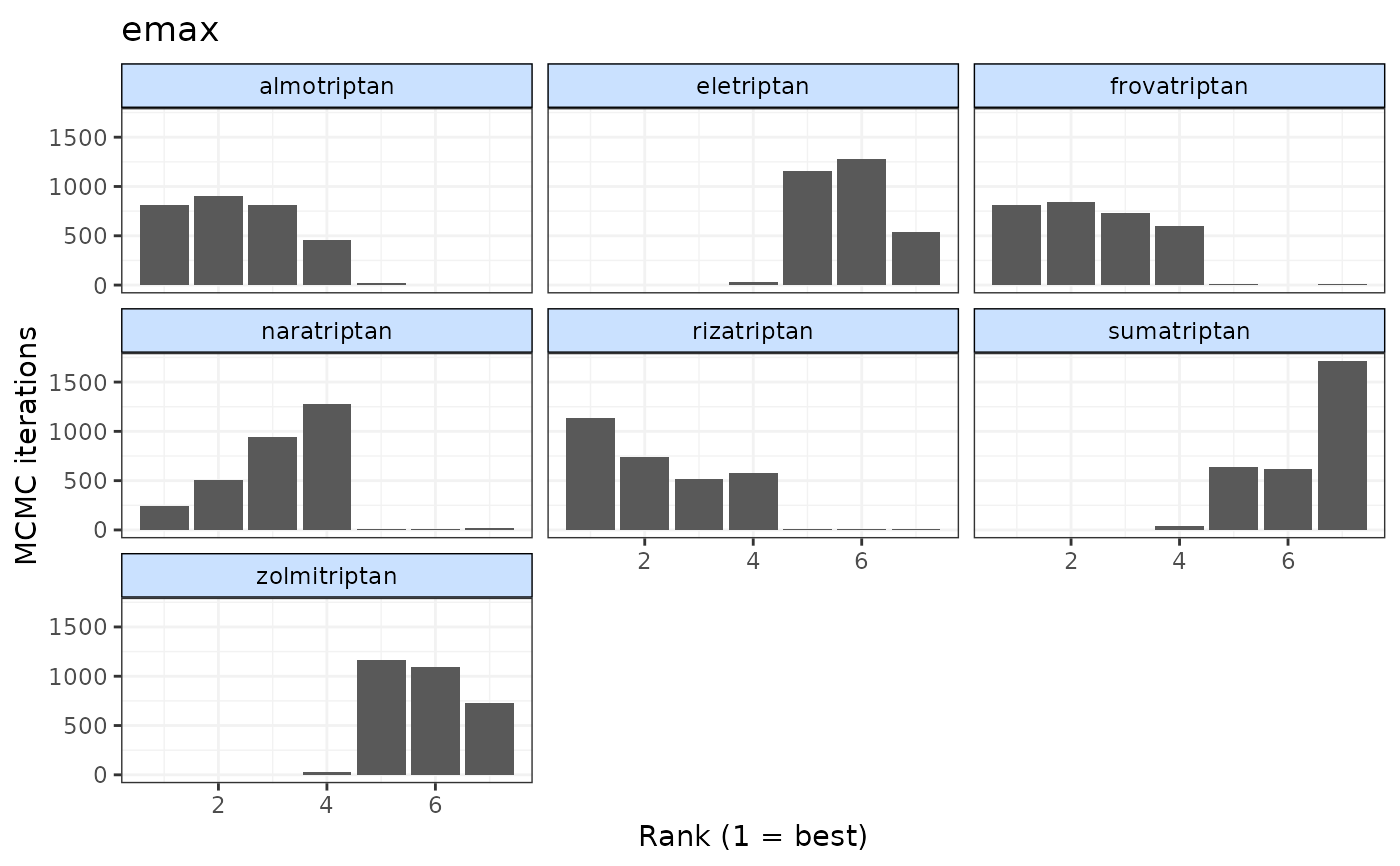
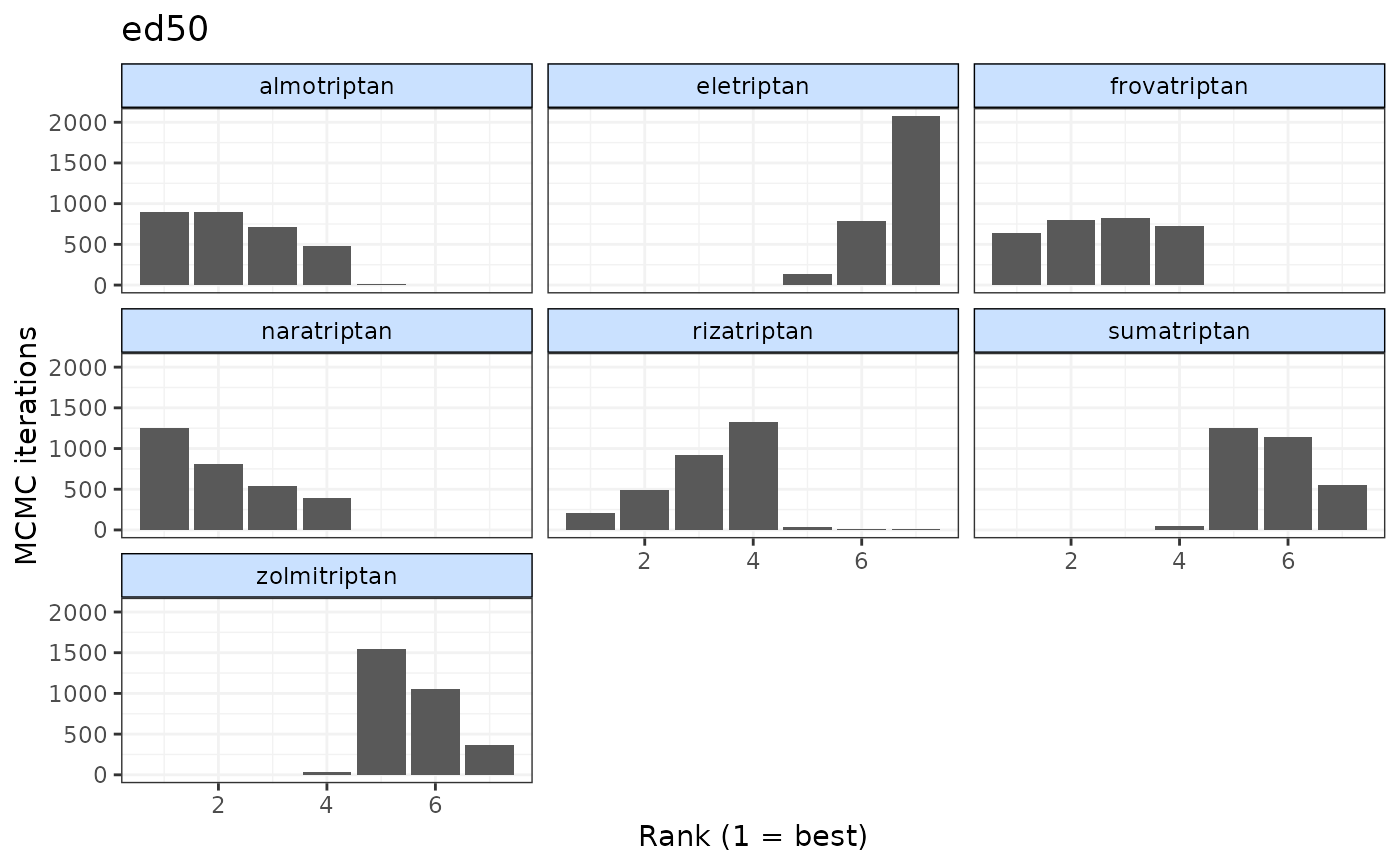 # Plot rankings just for ED50
plot(ranks, params="ed50")
# Plot rankings just for ED50
plot(ranks, params="ed50")
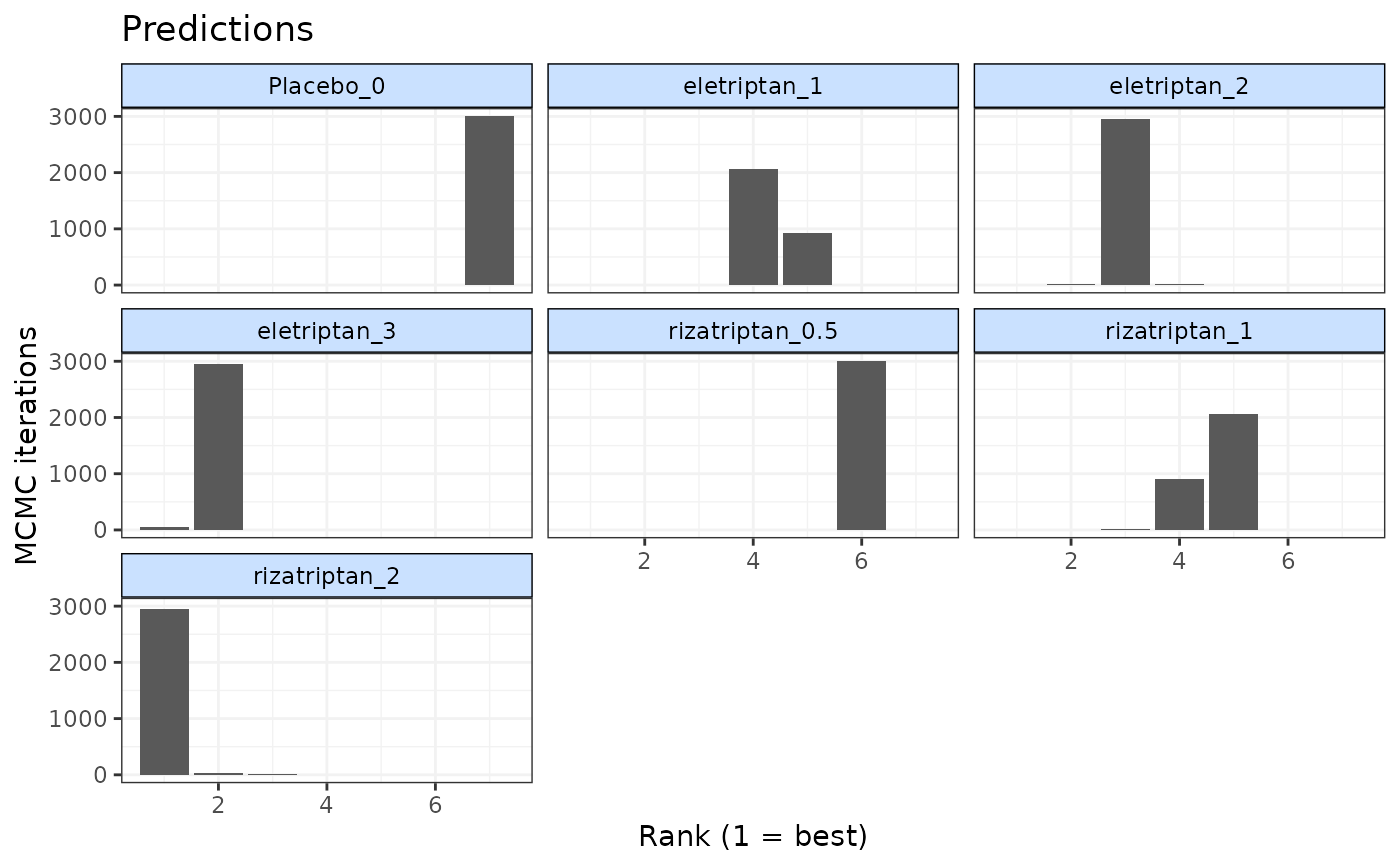
 # Plot rankings from prediction
doses <- list("eletriptan"=c(0,1,2,3), "rizatriptan"=c(0.5,1,2))
pred <- predict(emax, E0 = "rbeta(n, shape1=1, shape2=5)",
exact.doses=doses)
rank <- rank(pred)
plot(rank)
# Plot rankings from prediction
doses <- list("eletriptan"=c(0,1,2,3), "rizatriptan"=c(0.5,1,2))
pred <- predict(emax, E0 = "rbeta(n, shape1=1, shape2=5)",
exact.doses=doses)
rank <- rank(pred)
plot(rank)
 # Trying to plot a parameter that has not been ranked will return an error
#### ERROR ####
# plot(ranks, params="not.a.parameter")
# }
# Trying to plot a parameter that has not been ranked will return an error
#### ERROR ####
# plot(ranks, params="not.a.parameter")
# }