Plot fitted values from MBNMA model
fitplot.RdPlot fitted values from MBNMA model
fitplot(
  mbnma,
  disp.obs = TRUE,
  n.iter = mbnma$BUGSoutput$n.iter,
  n.thin = mbnma$BUGSoutput$n.thin,
  ...
)
Arguments
- mbnma
An S3 object of class
"mbnma"generated by running a dose-response MBNMA model- disp.obs
A boolean object to indicate whether raw data responses should be plotted as points on the graph
- n.iter
number of total iterations per chain (including burn in; default: 2000)
- n.thin
thinning rate. Must be a positive integer. Set
n.thin> 1 to save memory and computation time ifn.iteris large. Default ismax(1, floor(n.chains * (n.iter-n.burnin) / 1000))which will only thin if there are at least 2000 simulations.- ...
Arguments to be sent to
ggplot2::geom_point()orggplot2::geom_line()
Value
Generates a plot of fitted values from the MBNMA model and returns a list containing
the plot (as an object of class(c("gg", "ggplot"))), and a data.frame of posterior mean
fitted values for each observation.
Details
Fitted values should only be plotted for models that have converged successfully.
If fitted values (theta) have not been monitored in mbnma$parameters.to.save
then additional iterations will have to be run to get results for these.
Examples
# \donttest{
# Using the triptans data
network <- mbnma.network(triptans)
#> Values for `agent` with dose = 0 have been recoded to `Placebo`
#> agent is being recoded to enforce sequential numbering
# Run an Emax dose-response MBNMA and predict responses
emax <- mbnma.run(network, fun=demax(), method="random")
#> `likelihood` not given by user - set to `binomial` based on data provided
#> `link` not given by user - set to `logit` based on assigned value for `likelihood`
#> Compiling model graph
#> Resolving undeclared variables
#> Allocating nodes
#> Graph information:
#> Observed stochastic nodes: 182
#> Unobserved stochastic nodes: 197
#> Total graph size: 4115
#>
#> Initializing model
#>
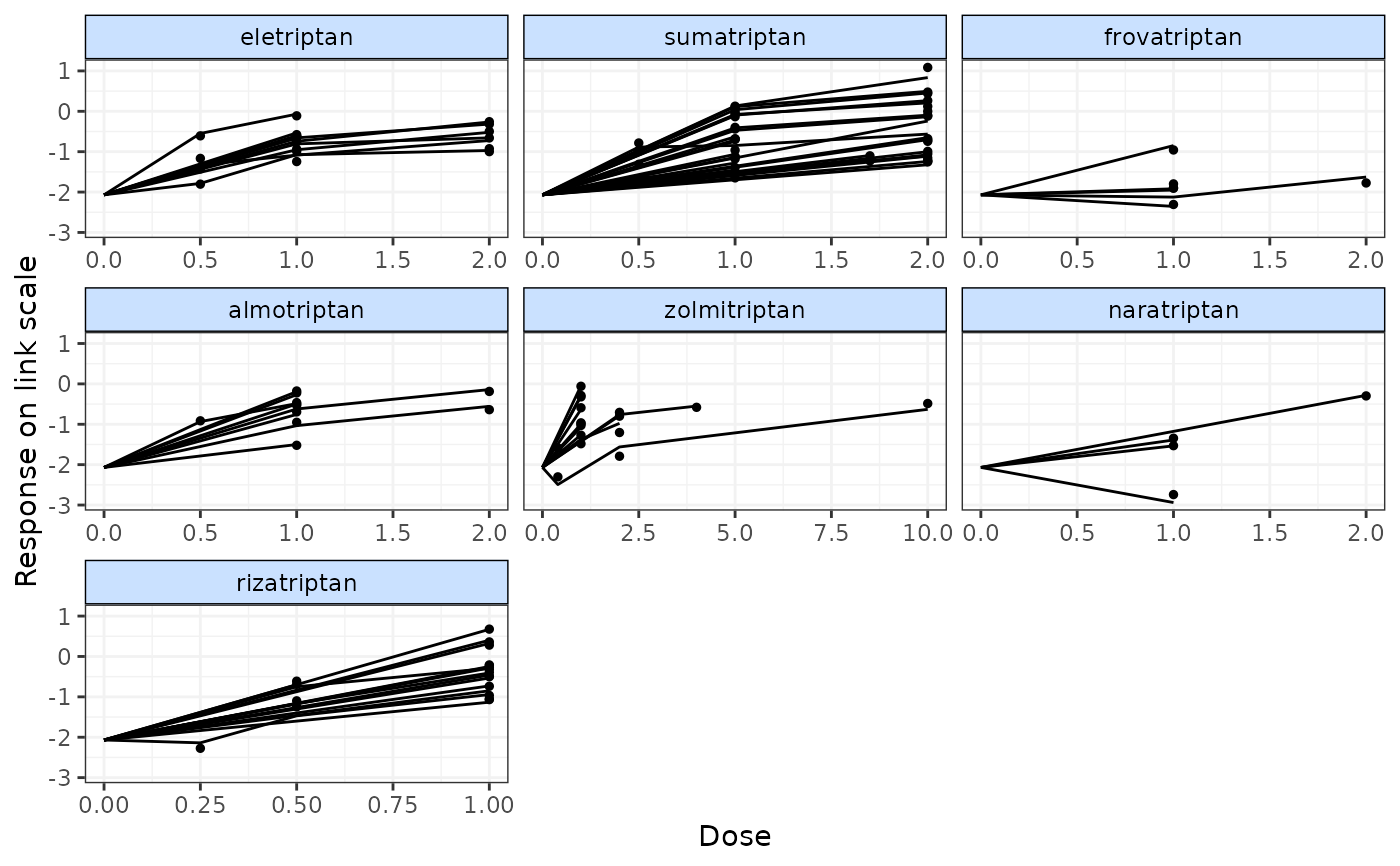
# Plot fitted values and observed values
fitplot(emax)
#> `theta` not monitored in mbnma$parameters.to.save.
#> additional iterations will be run in order to obtain results
 # Plot fitted values only
fitplot(emax, disp.obs=FALSE)
#> `theta` not monitored in mbnma$parameters.to.save.
#> additional iterations will be run in order to obtain results
# Plot fitted values only
fitplot(emax, disp.obs=FALSE)
#> `theta` not monitored in mbnma$parameters.to.save.
#> additional iterations will be run in order to obtain results
 # A data frame of fitted values can be obtained from the object
#returned by `fitplot`
fits <- fitplot(emax)
#> `theta` not monitored in mbnma$parameters.to.save.
#> additional iterations will be run in order to obtain results
# A data frame of fitted values can be obtained from the object
#returned by `fitplot`
fits <- fitplot(emax)
#> `theta` not monitored in mbnma$parameters.to.save.
#> additional iterations will be run in order to obtain results
 head(fits$fv)
#> study arm mean facet fupdose groupvar studyID y
#> 711 1 2 -2.0666810 sumatriptan 0.0 1 27 NA
#> 71 1 2 -0.8954972 sumatriptan 0.5 1 27 -0.7845814
#> 141 1 3 -0.8668756 sumatriptan 1.0 1 37 -0.9614112
#> 211 1 4 -0.5589886 sumatriptan 2.0 1 66 -0.7429087
#> 721 2 2 -2.0666810 eletriptan 0.0 2 27 NA
#> 72 2 2 -0.7428307 eletriptan 1.0 2 27 -0.7522361
# }
head(fits$fv)
#> study arm mean facet fupdose groupvar studyID y
#> 711 1 2 -2.0666810 sumatriptan 0.0 1 27 NA
#> 71 1 2 -0.8954972 sumatriptan 0.5 1 27 -0.7845814
#> 141 1 3 -0.8668756 sumatriptan 1.0 1 37 -0.9614112
#> 211 1 4 -0.5589886 sumatriptan 2.0 1 66 -0.7429087
#> 721 2 2 -2.0666810 eletriptan 0.0 2 27 NA
#> 72 2 2 -0.7428307 eletriptan 1.0 2 27 -0.7522361
# }